Blog by Yara Toenders and Karlijn Hermans
On 9th November 2022 the research day of the All Schools Collect/Come Together (Alle Scholen Verzamelen) 2022 took place with the project ‘We find!’. Around 3000 children from 76 primary schools across the Netherlands participated in the project organized by the Science Communication Hubs in collaboration with Karlijn Hermans and Yara Toenders. They each visited a primary school in Leiden and Rotterdam that participated in the project: Primary school Anne Frank in Leiden and Quadratum in Rotterdam.
What is All Schools Collect Together?
All schools collect together is a citizen science project, where pupils in class 6, 7 and 8 are citizen researcher for the day. In the project ‘We find!’ they researched whether their voice is similar to the voice of adults who influence their social environment when it comes to what the pupils find important in their social environment. Pupils chose the social environment they wanted to focus on: home, the school or the neighbourhood. Using the data collected by the pupils, the researchers will study whether there are differences between these environments in terms of whether children’s voiced are being heard, and if there is a relation with social-economic status and urbanicity. The research topic ‘social behavior and environment’ is extremely timely because of the COVID-19 pandemic. During the pandemic and lockdowns, adults restricted the social environment of children, therefore the researchers aimed to teach the pupils about their social environment and to listen to their voices. The age of these children, late childhood and early adolescence, is of importance when it comes to the development of social skills and growing up to be resilient adults.
The research day
In a preparatory class, the pupils created a ranking in the class with 5 topics they need most to be social at home, school or in the neighbourhood. To study whether adults find similar topics of importance as they do, the pupils interviewed an adult on the research day. They worked in groups and they each had their own role based on what their strengths are or what they would like to learn. To teach the pupils about team science (where researchers collaborate and complement each other’s expertise to together reach a goal), pupils chose a role within the groups such as interviewers, analysts, and designers. They took the lead in the respective parts of the research.
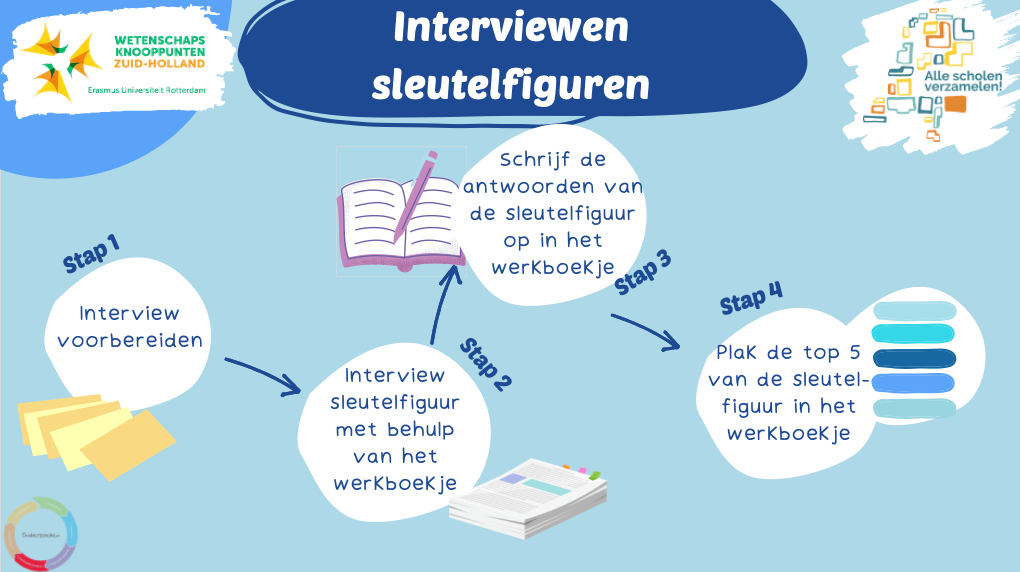
Instructions to interview the key figures
The interview
The pupils invited a key figure to take part in their interview. Depending on the environment that the pupils focused on, the key figures were for example teachers, parents or the mayor. During this interview, the key figures were asked to rank the 5 topics that were listed by the pupils according to to what degree they act upon or are concerned with the topics. At the school in Leiden the school environment was picked and several teachers and the school directors were interviewed, both physically as well as virtually. One of the groups interviewed a teacher on the research day, but also interviewed the mayor of Leiden later in the week. The pupils were quite nervous before the interview started. For most of them it was a first, and they were happy to have a script. After a while the pupils got more comfortable and also asked questions that weren’t scripted such as ‘why do you find this research important?’. For some groups the interview turned into a conversation starter to discuss social security and bullying: do the teacher notice when a pupil is being bullied?
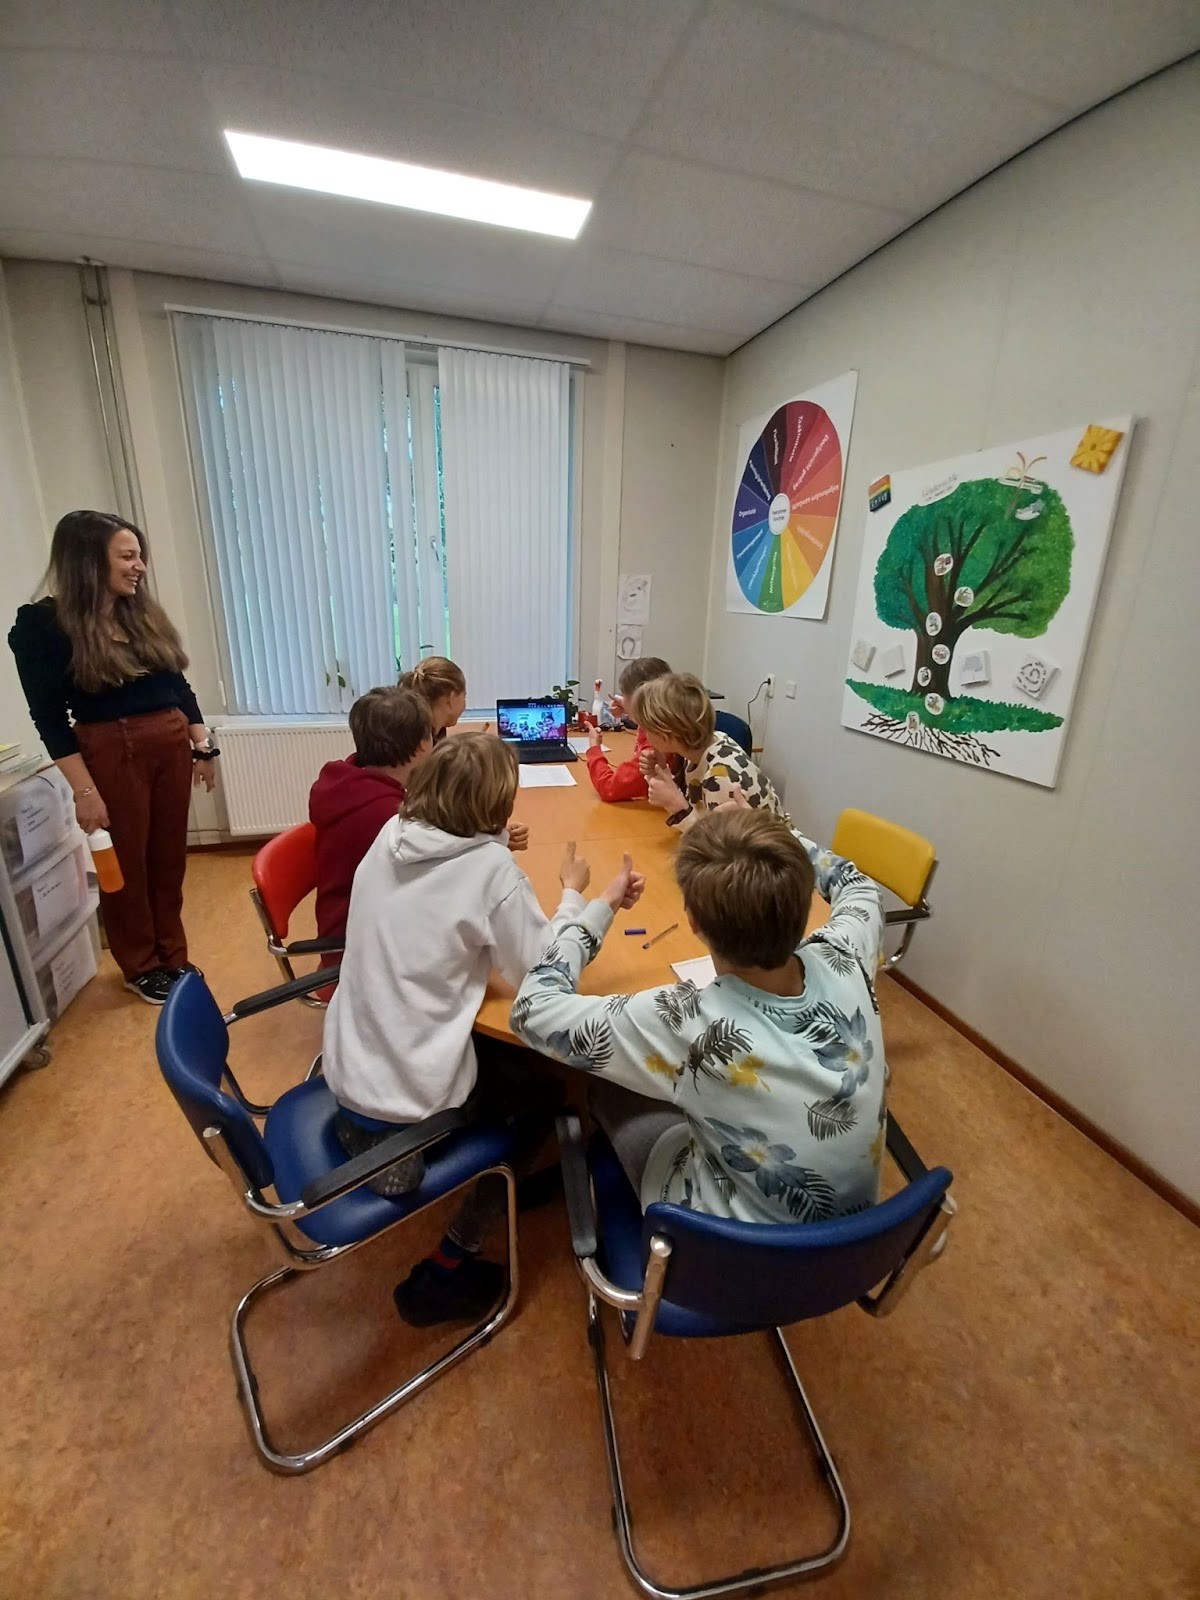
A group of pupils from OBS Anne Frank in Leiden interviewing the director of the school via Teams
In Rotterdam the pupils were very enthusiastic that they were going to interview the school director. Especially offering him a drink was a highlight. When they entered the director’s office the tension increased, who was going to take the lead in the interview? But after the first question was asked, the rest of the interview went smoothly and the school director was really enthusiastic when talking about the social environment of the children. Afterwards, one of the pupils said that the interview was ‘fun but the responses were a bit complicated’. Does that mean that the key figure looks differently at the social environment than the pupils do?
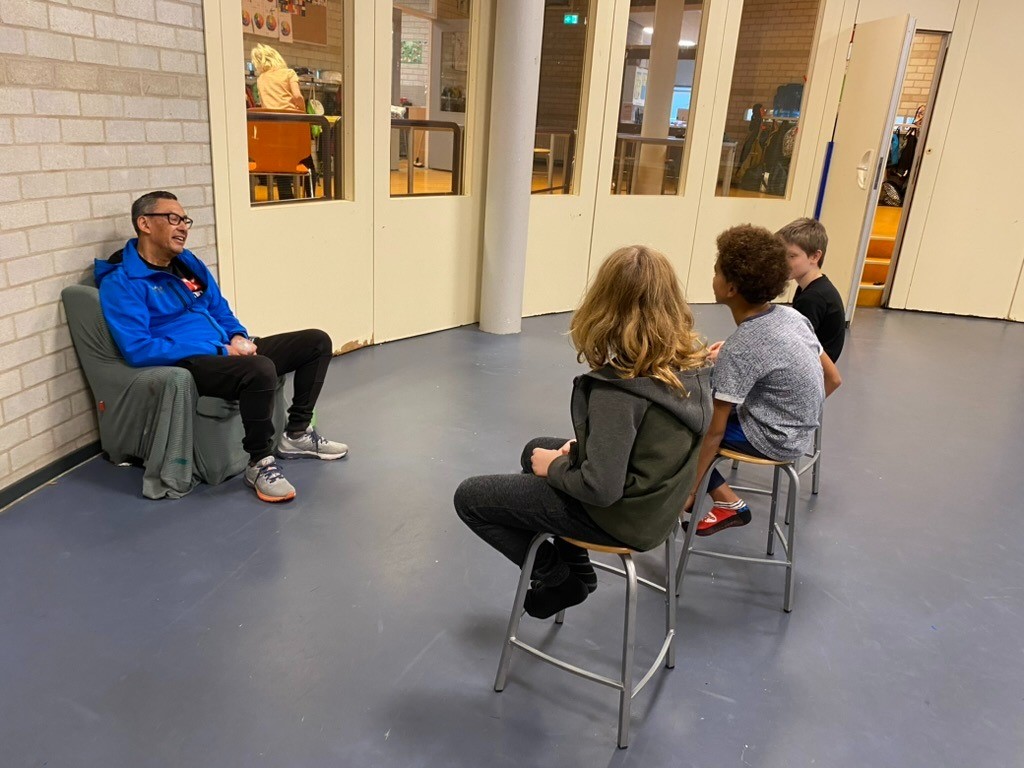
A group of pupils from the Quadratum school in Rotterdam interviewing the physical education teacher
The data processing phase
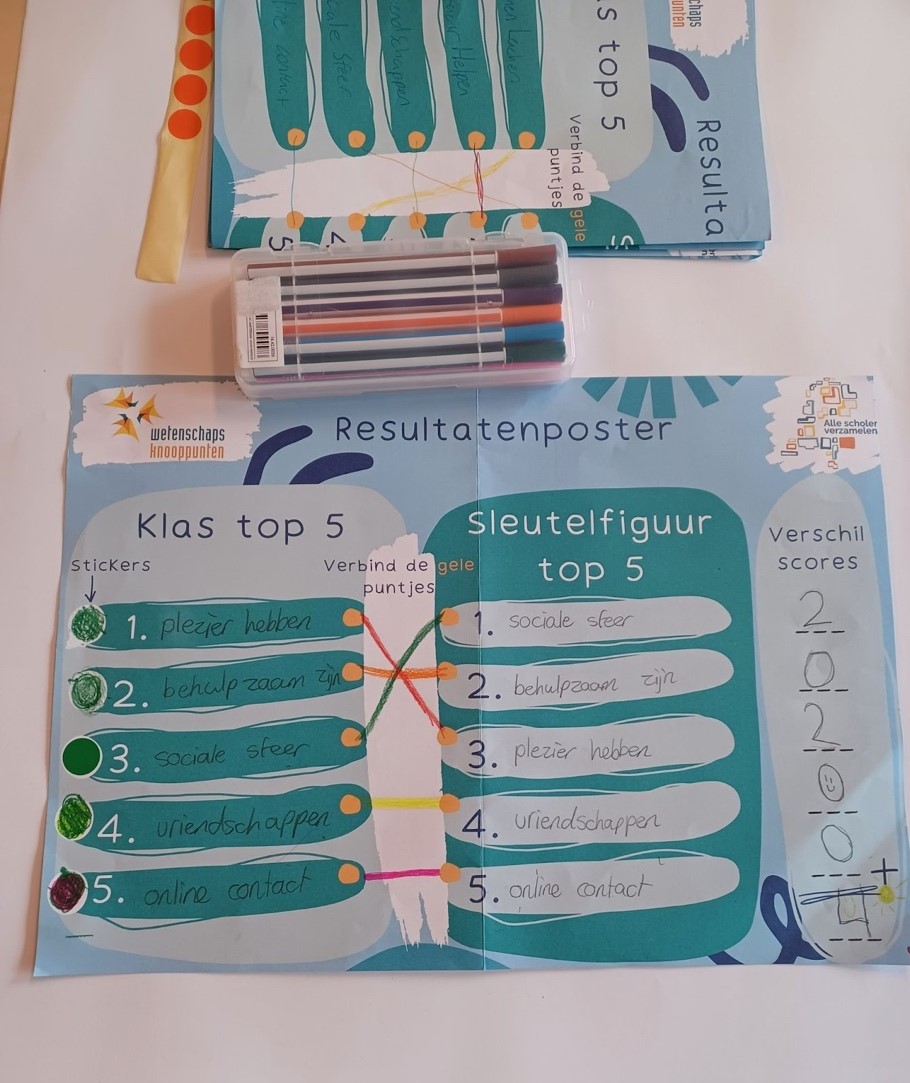
Under the supervision of the data analysts from each group, the pupils processed the results. They calculated the difference score between the class top 5 and the top 5 of the key figure based on the result poster. A higher difference score meant that the priorities from which was found important in the social environment from the children’s perspective was different from what was found from the key figure’s perspective. In addition, the pupils indicated with colours for each of the top 5 elements whether something is already available in their environment or not (yet). On the back of the result poster, the pupils worked on the interpretation of the results: what was the reason that the key figure had a different top 5? Or how come that both the top 5 were similar?
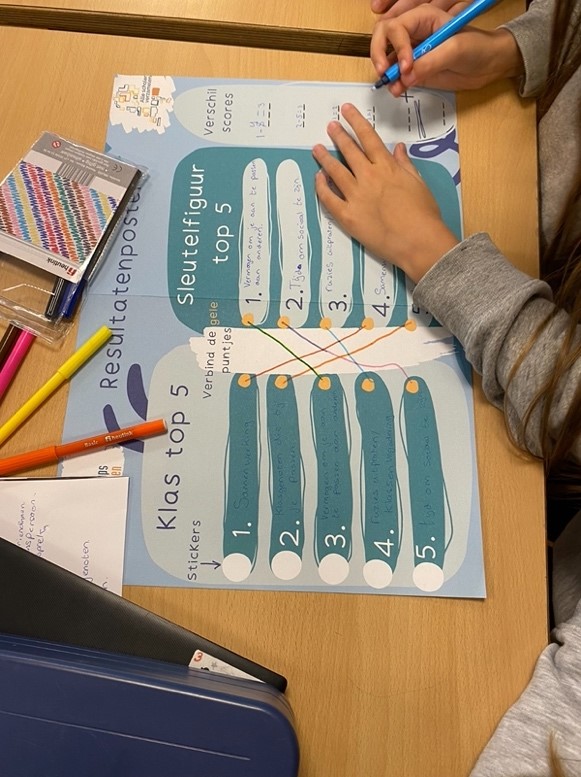
The result poster of a group at the Quadratum school in Rotterdam (above).They ranked ‘time to be social (for example breaks) fifth, whereas the key figure ranked it second! The result poster of a group of pupils at OBS Anne Frank in Leiden (below). Here, there was a lot of agreement.
This is something that seemed to be not so easy, because how would you know what the results could mean? It helped to have a couple of options to choose from, as it was often clear which interpretation was not applicable. In some groups, the results in Rotterdam showed a lot of resemblances between the class top 5 and the top 5 of the key figures, which was explained as ‘indeed, the teacher listens to us very well’. In other groups, there appeared to be more differences, as sometimes the aspect that children picked as their number 1 was put in 5th place by the key figure. In Leiden, all groups presented their interpretation and what stood out to them most. It seemed to boil down to the conclusion that key figures think more broadly than children, as they prioritized the elements taking into account a variety of factors and dependencies, while children often look at the elements they needed separately from each other. Of course, the aggregated results will show whether this is a representative finding, but at least it shows that, at the school in Leiden, children and key figures became more understanding of each other and each other’s perceptions. We are very excited to see if this will also show based on the results!
The visualization phase
In the final phase, the designers worked on creative ways to visualize and communicate the results. At the schools in Leiden and Rotterdam, there was a lot of variety and enthusiasm: rap, digital posters, histograms, comics, movies and drawings were made to communicate the conclusions of the research project.
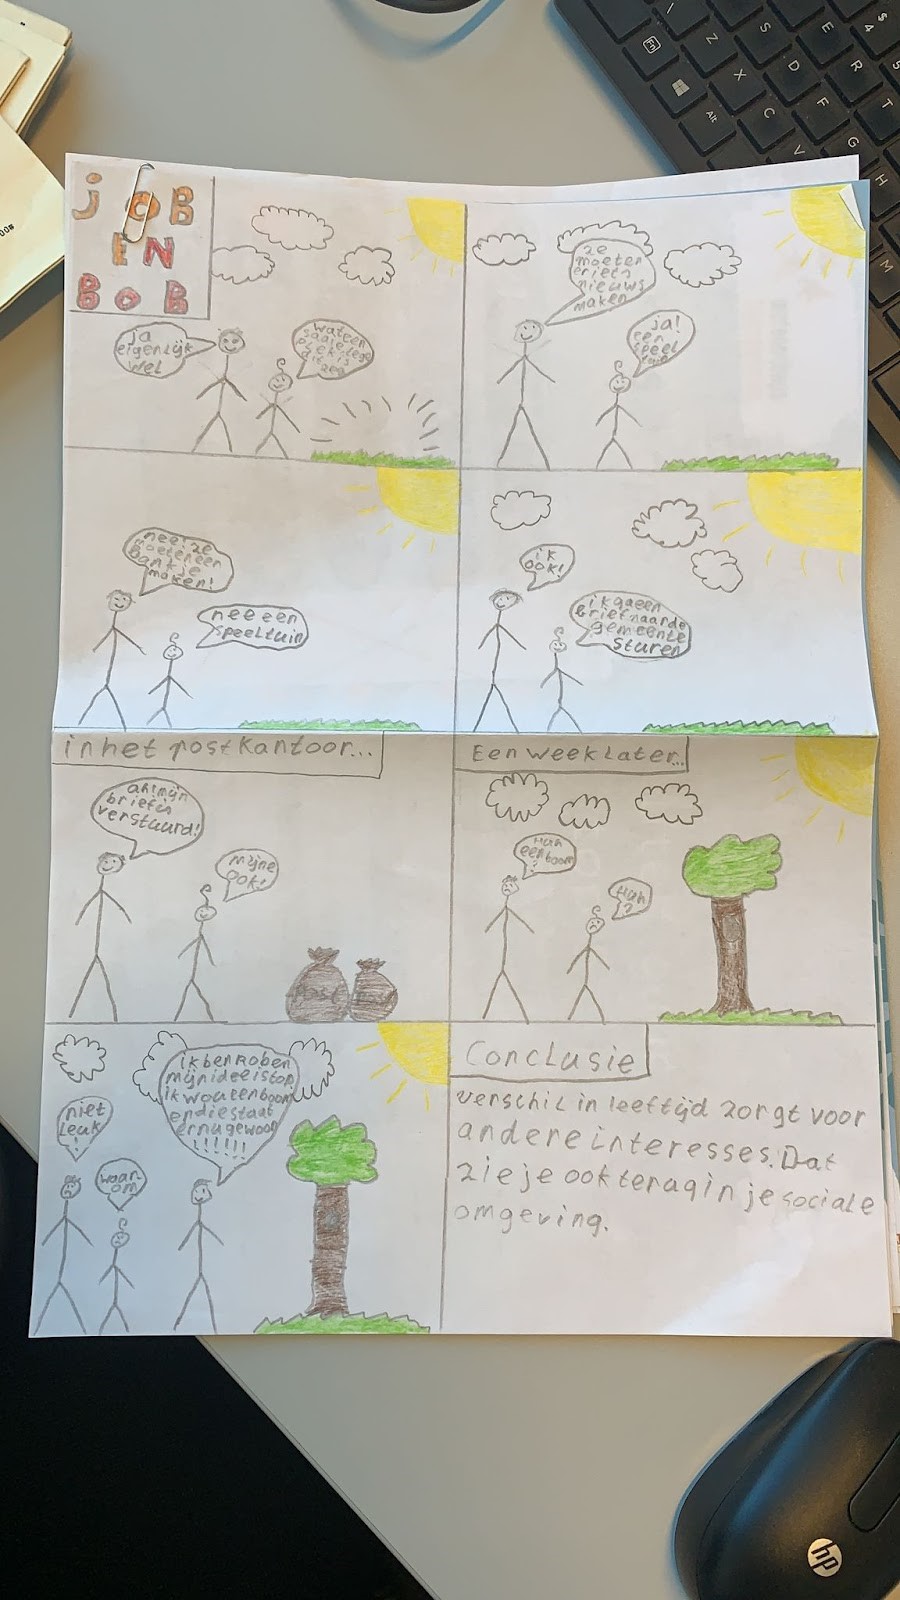
Example of the presentation; a comic where two people talk what they would like their environment to look like.
The message that would be central on the poster was clear within 5 minutes – ‘Adults find other things important in the social environment’, however, the blue color on the background caused more discussion. From the rap it appeared that the pupils thought it was most important to adapt to others, but this had to be put into practice still in choosing the background color.. At least the first steps in learning what is important in the social environment have been taken!
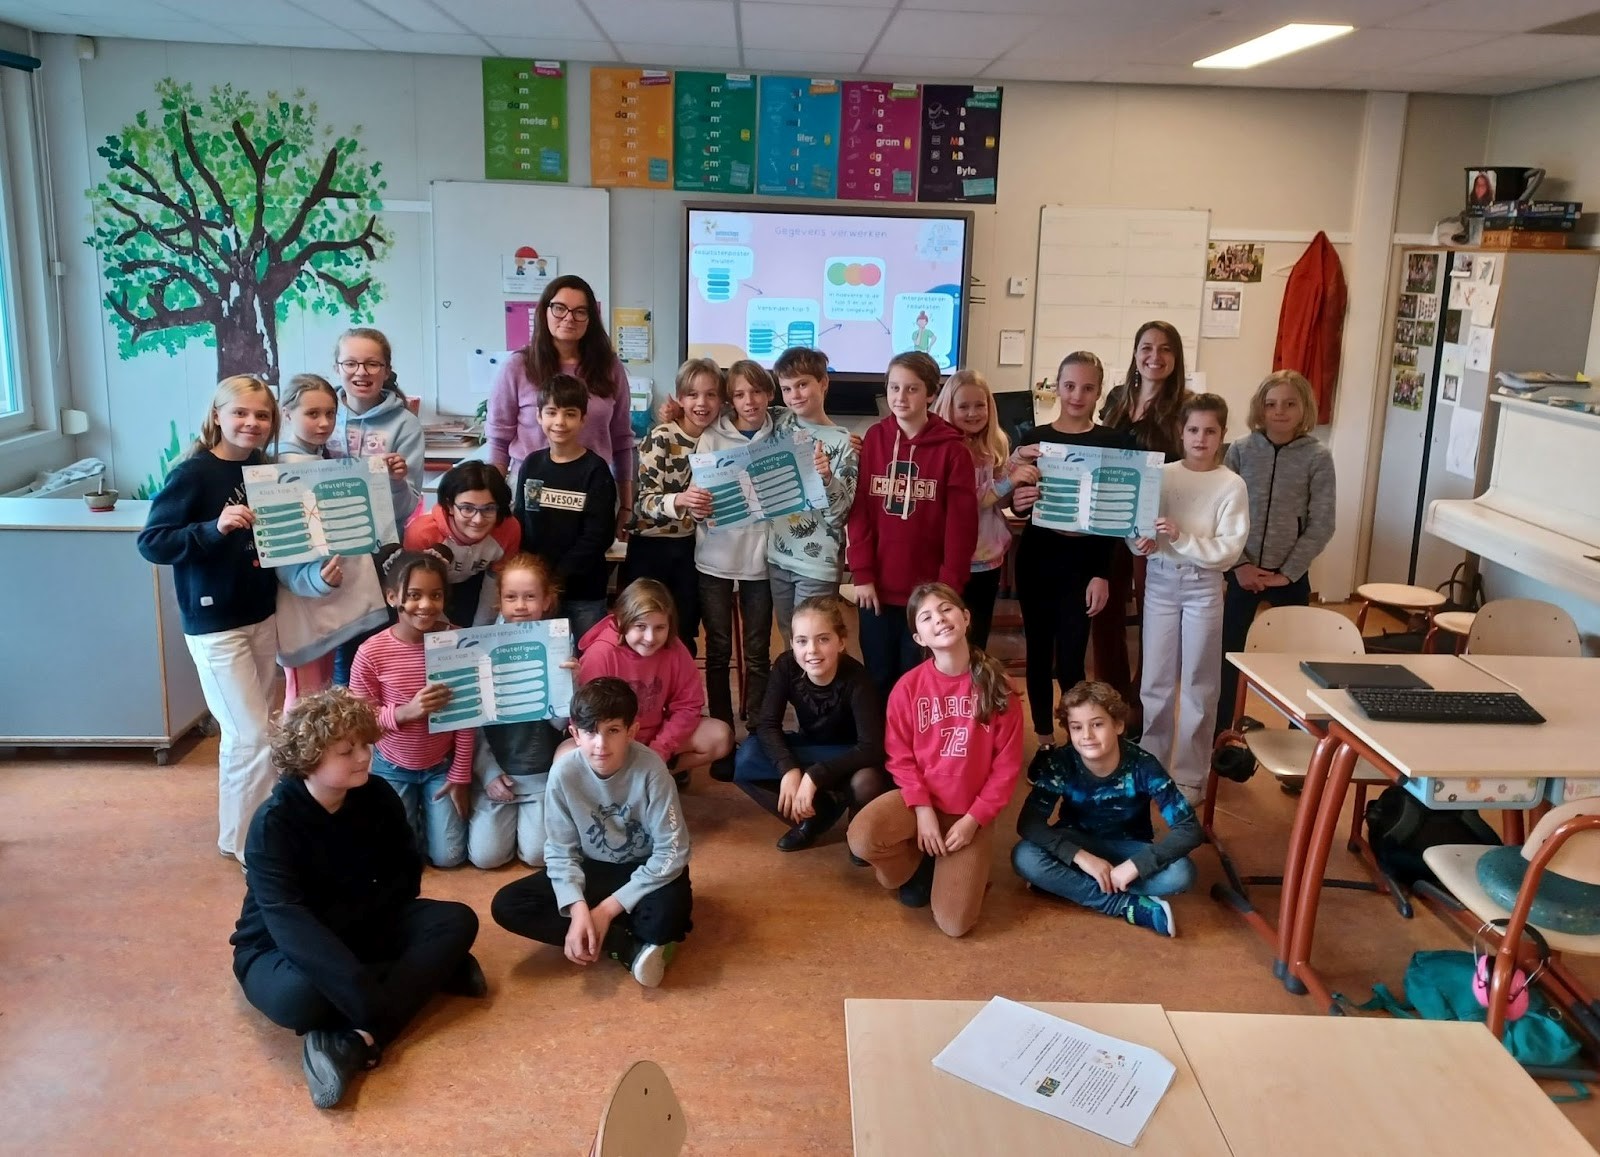
The proud pupils of OBS Anne Frank in Leiden with their teacher and researcher Karlijn!
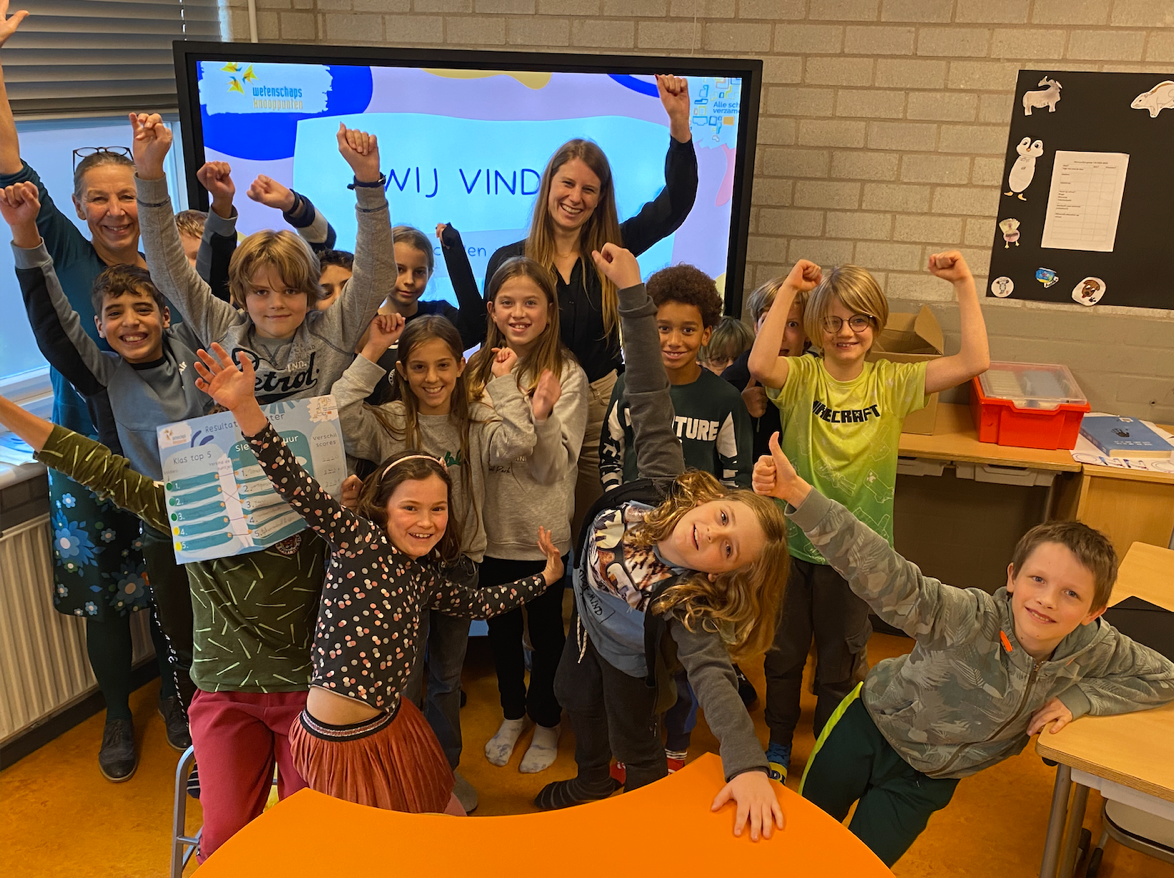
The enthusiastic pupils of the Quadratum school in Rotterdam with their teacher and researcher Yara!
More information about the successful research day, including the perspective/interviews with Karlijn and Yara, can be found on the website of the University of Leiden and the Erasmus University Rotterdam. All the creative presentations will be collected on the website www.allescholenverzamelen.nl. Until the 1st of December, the pupils can download their visualization. The class with the most beautiful/best/most creative/most convincing visualization will win a price! This class may visit the Erasmus University for a tour and see for themselves what is being done with the data they collected. So, be quick to upload your visualization!
When all data has been sent to the researchers, they will combine it all. In 3 months, in February, the first results based on the collected data from all the pupils from the entire country will be shared with the participating schools. Of course, this wouldn’t have been possible without all the hard work of the citizen scientists on the primary schools. Thank you all very much for participating in the project and doing the research! Also a big thank you to all the teachers and schools that participated in the project Alle Scholen Verzamelen!

