
“Societal impact is investing in creative ways to engage the future generation in science.”
On Expedition in Franeker: Social SYNC lab
On the 6th of May, the SYNC lab presented the Social SYNC Lab at Expedition NEXT; the national science festival for children, organized by the NWO-NWA. The festival was sold out, which means that 6000 children and their caregivers came to the former university city Franeker to learn more about and experience science. The goal of the NWO-NWA was to get children and their parents excited about science and spark their curiosity. In festival-style, children could really experience and engage in all fields of science. Expedition NEXT fits in the broader ambition of NWO-NWA to show the value and importance of science to society. SYNC shares this ambition and therefore contributed by developing a special Social SYNC Lab; designed to represent important parts of our research on social development in children and youth. Our Social Lab consisted of three main parts, reflecting different research lines within SYNC: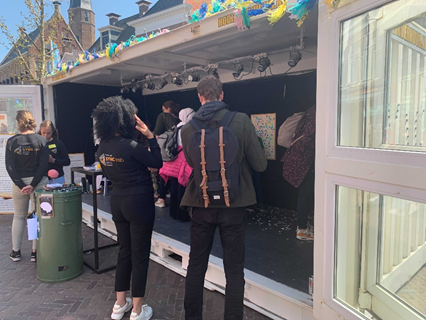 self image, the voice of children, and brain synchronization. In addition, children could ask Eveline Crone everything about friendship and feeling good in a mini lecture. The overall question and topic of the Social SYNC Lab for children and their parents to engage in was: ‘Why do you need others to feel good?’
Self image: Discover your superpower!
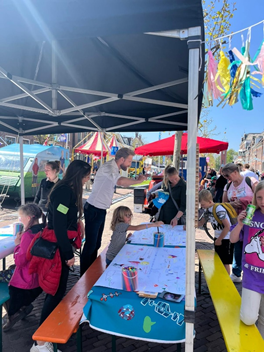
 Based on our research line on the development of self image, we wanted children and their caregivers to experience the association between giving and receiving compliments – superpowers – and feeling good. We asked children to pick already written compliments or write compliments themselves on stickers and give those to someone else, such as their caregiver, a friend or a brother or sister. Examples of compliments were ‘you are a good friend’, ‘you are a kind person’ and ‘you are good at helping others’. The researchers asked children how they felt when they gave a compliment compared with when they received one. They showed children that both can make you feel happy. A cool side effect of the stickers was that children and caregivers walked away with the compliments on their shirt, feeling good about it the rest of the day and showing others their compliments!
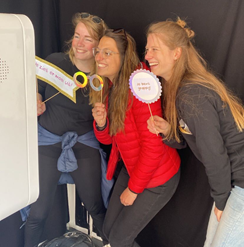 After the giving and receiving of compliments, children and their caregivers could also take a picture in the compliment photobooth in which three pictures were taken. When waiting in line, children were encouraged to select a compliment on a stick about each other. The first picture was taken without props. For the second picture, children pointed the compliment on a stick to the other on the picture; sometimes creating a nice surprise! For the last picture, children could either pick another compliment or make a crazy picture, using other props such as a moustache or party glasses. We printed the
 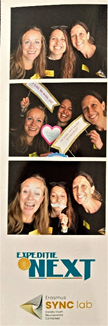 children’s series of three photos instantly, asking them whether they saw differences between the first and second picture. Did they feel happier? Did they also see this in the picture? Why did they think this was the case? Could this be linked to giving and receiving compliments? It was nice to see and hear that caregivers engaged in conversation with the children afterwards; continuing on the question how often and when they would give and receive compliments and how it made them feel. Some children said they were already giving a lot of compliments and now they understood why this made them happy. The instantly printed photos also gave the children and their caregivers a nice memory of the Social SYNC Lab at Expedition NEXT to stick on the fridge door!
Make your voice heard!
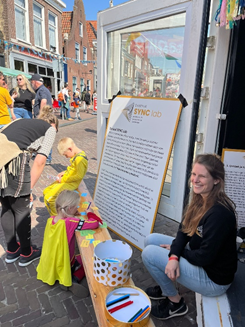
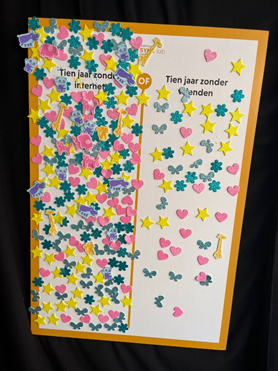 Within SYNC, we value the voice of (unheard) youth and study how and why they want to contribute to society. We also work with novel methods with which we engage youth in our studies, such as using a living lab approach or citizen science. In our Social SYNC Lab, we asked children to express their voice as well. One way of doing this was by asking children to choose one of the two statements framed as difficult dilemmas. These dilemmas included topics important to children, such as ‘rather living without friends or living without internet’ or ‘rather being the boss of the Netherlands or being a famous celebrity’. We distinguished different age groups based on the color of the stickers they used to make their choice. It was nice to hear and see the conversations the dilemmas started between the children and their caregivers or between brothers and sisters. It was interesting to see that older children typically chose to be the boss of the Netherlands over being a famous celebrity and children picked the middle line between rather giving or rather receiving compliments. It was also striking to see that some older children preferred to live without friends rather than living without internet. They said that they had friends on the internet as well. We discussed the choices with caregivers and children and linked what we saw to our research.
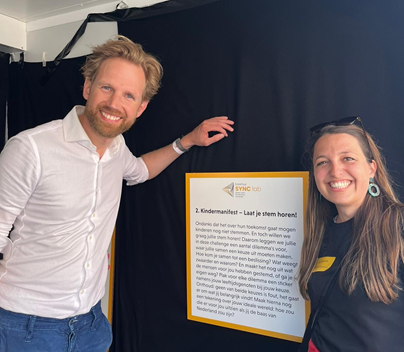
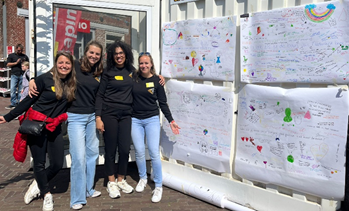 In addition to the dilemmas, children were encouraged to envision their ideal world and draw elements of this world on a blank canvas. They were prompted by questions such as ‘Imagine, you’re the boss of the Netherlands.. what would you do to free the world of bullying?’ Or ‘what would you do to help other children to feel happy?’ Children came up with lots of interesting and out of box ideas. It was nice to see that a lot of them were about their (social) environment, such as placing more fountains. Some of them were also very idealistic, such as giving poor children more money, but it was refreshing to see how children think and dream about their future. In the afternoon, the minister of Primary and Secondary Education, Dennis Wiersma, visited the Social SYNC Lab. He was interested to see the outcomes of the dilemmas and of course also what the children find important. Just like he has been inspired for education policy, we as researchers will use the input of the children as inspiration in our studies on social development and the role of the social environment.
Dance your brain in SYNC!
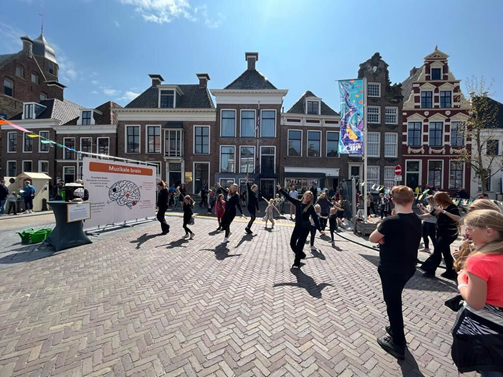
 The third research line we translated into a festival element was on the musical brain and the role of (movement) synchronization in stimulating interaction and joy between people. In order to make children (and their caregivers) experience this synchronization, we collaborated with dance teacher Kimberley from Crea bij Kim. She and her dance group prepared a simple and joyful dance for children to spontaneously join. Children were encouraged to join and move together. The more children who joined the dance, the more the ‘brain’ would be filled with water of joy. We also showed the brain parts that are active when moving together, linking their movement to their brain. The dance was very popular and well-attended and the large musical brain attracted also other groups who made music in Franeker, such as the local marching band!
Expedition NEXT contributes directly to societal impact
This reflection on Expedition NEXT in Franeker started with the ambition we as a lab share with NWO-NWA, bridging science and society by motivating children to become curious about science. I loved to see how inclusive this festival-style science event was, as it attracted a variety of children and caregivers. Although the festival was focused on children between 6 and 13, it also attracted younger children and grandparents. There were groups of children from the Asylum Seekers Centre who could still join the activities as they could engage without speaking the Dutch language. This also applied to children with disabilities, who could still join a lot of activities. Therefore, the festival was a great way to engage all children in science activities. To me, societal impact is investing in creative ways to engage the future generation in science, sparking their curiosity, feeding their critical mind, and really listening to them. Expedition NEXT was a perfect example of this!
Read and watch more!
Here you can find the Twitter thread we made on the day itself. We also made a (Dutch) vlog about the day! Watch it here! On the website of Expedition NEXT, you can find more impressions of the day and follow Expedition NEXT on tour.
 Heunis, Stephan. (2022). F.A.I.R Data Management with DataLad – a comic strip. Zenodo.
